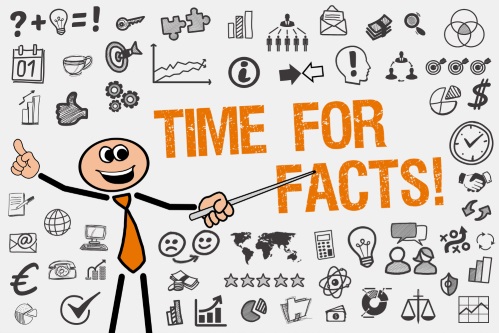
If you listen carefully, yes data talks and tells interesting stories! All answers to your questions and doubts are buried in there. If you dig deeper, you are sure to mine for gold!
Data has numbers which are FACTS, NOT OPINIONS! Who does not tend to believe more on facts and figures? At least I do and I bet you do too!
There are few questions which drive my curiosity. For example:
- Where do I find answers to the hypothesis I carry in my mind?
- What is that my users are looking for?
- How do I improve the product quality by looking just raw figures and visualize it, and finally make sense of it?
Here is exactly what Data analytics (DA) helps us do and why I rely on it:
- It enables us to make more-informed business decisions and verify whether or not our theories and hypotheses hold true.
- It examines data sets in order to draw conclusions about the information they contain about your product.
- Data Analytics helps us ensure we are moving in the right direction and quickly change our strategy if we aren’t.
- Data Analytics helps you stay proactive, visualize your data, increase collaboration.
Let’s get to the interesting part of Why, What, Where and how.
1. WHY DATA ANALYTICS? The importance:
Data analytics is vital to understand for your business to steer in the right direction. Data and valuable information pours into your Analytics every hour, each day. We need to monitor and make sense of that data regularly. It’s not wise to just store it, or ignore it. Use it to help you make better decisions for your businesses’ future growth.
It helps you ENGAGE WITH YOUR USERS, and I am sure you definitely don’t want to miss out on the prospective clients who need your services and are interested in doing business with you. Right?
Depending on your domain, Data Analytics for businesses fulfills various needs, increases customer knowledge and retention, strengthens client bonds by understanding their needs, and enrich your service offerings with new data insights and knowledge.
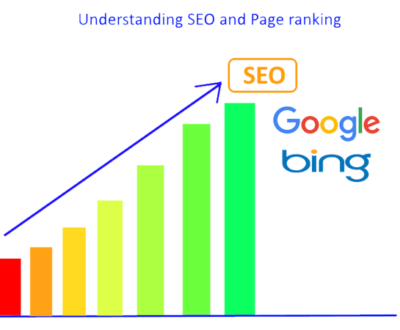
2. WHAT TO ANALYSE? Now, that’s the soul of WHY!
Depending upon your hypothesis, business strategy and other questions in your mind or may be your last Marketing meeting, your area of research could be SEO, social, referral traffic. Let’s group our types of data to make it easier to understand:
- Metrics: as your unique visitors, and the repeat visitors?
- Channels: How people find your products and website: Organic, referral, or direct channels?
- Social: What social networks drive traffic, Most socially shared content. Top “socially referred” pages.
- Local Business marketing: you might want to know where your visitors are from.
- Device Dive: What percent of your visitors are mobile? Are they on IPad, IPhone, or Android?
- Entrances/Exits: Drill down to the entrance and exit points on your website. This will help you to improve the content by improve the actual content, user-experience, design, links, call to actions.
- Keywords: What are the main keywords and phrases which your users are querying for?Hmm, isn’t that a lot of insight parameters? I agree, it is. That’s why we need to come up with few parameters or variables we may want to slice and dice our data based on at once.
3. WHERE TO BEGIN?
So first start with a set of questions, go through available data and once you start finding answers in your data, use it as a first step to more advanced research and create your Custom Dashboards for a better visual interpretation. Remember, one dashboard won’t deliver all answers to all your questions. A dashboard should address a particular challenge, a question, or your specific Business strategy. It should be visually appealing and simple to understand. Now, you may wonder and ask me , why visually appealing?
Well, Data’s visual appeal is one of the most important, overlooked but one of the best ways to explore and understand data, particularly when you are presenting it to your customers, investors or other stakeholders.
4. HOW DATA ANALYTICS? The tools of the trade:
I am sure, you may have heard this before. Abraham Lincoln’s productivity secret was to use sharper tools to get the job done more efficiently.
He said: “If I had three hours to chop down a tree, I’d spend the first two hours sharpening the axe.” So, having the right set of tools is so very important.
Data come from many different channels, in many different shapes and sizes and interpreting it doesn’t have to be overwhelming or difficult. You just need to approach it with the right set of tools and preparation. Put your data Analytics knowledge into real world and dive deep in the data. Approach it with a set of question or a hypothesis in mind and check if the data gathered confirms your assumption. What follows is a list by no means complete, but a comprehensive list of some of the popular different data analytics tools available and few which I have used personally. Some are free, others do have a fee. Depending on the volume of the data you are targeting to analyze, and the capabilities you may be looking for. They are in just a random order:
Tableau, The R language, Microsoft Excel, Google Fusion tables, Dataiku, Knime, Chart.io, Power BI and Python.
Don’t underestimate Microsoft Excel! I think, it is one of the most widely used analytics tools given its massive installed base. You won’t use it for advanced analytics for sure, but it supports all the basic important features like summarizing data, visualizing data, and basic data manipulation. Tableau is a data visualization software package and one of the most popular on the market. It’s a fast visualization software which lets you explore data and make all kinds of analysis and observations. Power BI is a web-based service from Microsoft for taking data from lots of different sources and visualizing and creating reports and dashboards.
So, tell me now, which tools do you prefer to use in your day to day work and why?
Data analytics can extract all kinds of patterns, trends, and actionable information from your large sets of data. Go ahead and turn that data into a competitive advantage!
Hi, I am a Web Developer, SEO Expert, Digital Marketing Analyst, and Co-Founder of LadyBird InfoTech – Austin’s Digital Marketing Agency. A Web Developer at the inventive intersection of Technology and Marketing. I enable my clients to be successful in their business by bringing value through their digital investments. I partner with my clients on how to leverage SEO, Optimizing Landing pages, implementing best practices for responsive Web development, Search Engine Marketing and other Digital marketing methodologies –to improve overall Brand Recognition, Search Ranking, Customer engagement, conversion and overall purchase funnel.
About us and this blog
We are a digital marketing company with a focus on helping our customers achieve great results across several key areas.
Request a free quote
We offer professional SEO services that help websites increase their organic search score drastically in order to compete for the highest rankings even when it comes to highly competitive keywords.
Subscribe to our newsletter!

Recent Posts
- The 8 Pillars of Social Media Marketing January 15, 2019
- Data Talks And Tells Interesting Stories! February 27, 2018
- Get your HTTPS on – Deadline July 2018 February 20, 2018